Article
Fundamental vs Technical Analysis: Two Different Lenses for Understanding Markets
When it comes to investing, one of the most common questions we hear is: “Should I look at fundamentals or charts?”
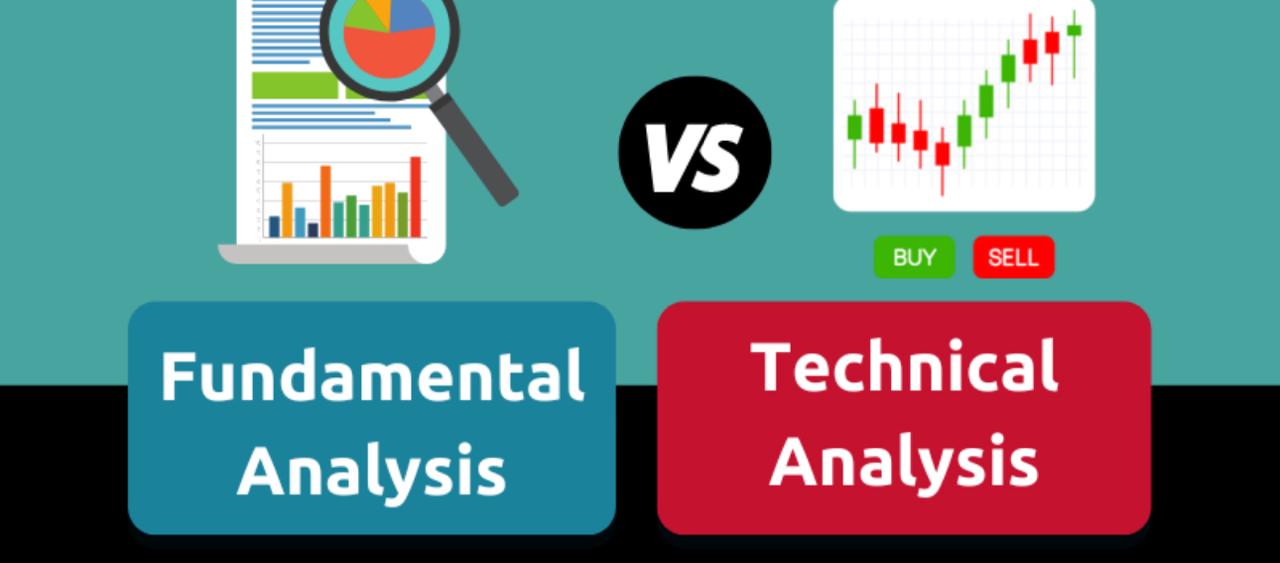
The answer is: they are not really competing approaches. They are two different ways of looking at the market.
Fundamental analysis tries to understand what an investment is worth.
Technical analysis tries to understand what the market is doing with that investment right now.
One looks primarily at the business and its underlying economics. The other looks at price, volume and market behaviour.
Understanding the difference can help investors make more informed decisions, and, more importantly, avoid using the wrong tool for the wrong purpose.
What is Fundamental Analysis?
Fundamental analysis is about understanding the economic and financial reality behind an investment.
For a company, an investor may study:
Revenue growth
Profitability
Earnings growth
Cash flows
Debt levels
Return on capital
Competitive advantages
Management quality
Industry dynamics
Valuation
Future growth prospects
The fundamental analyst is essentially asking:
“If I own a part of this business, what is that business likely to be worth over time?”
For example, imagine a company that has consistently grown its revenues and profits, has a strong balance sheet, generates healthy cash flows and operates in an industry with long-term growth potential.
Fundamental analysis would attempt to determine whether the company's current market price adequately reflects those prospects.
This is particularly relevant for long-term investors because, over longer periods, business performance tends to have a significant influence on investment outcomes.
Fundamental analysis is therefore largely about:
Business → Earnings → Cash Flows → Value → Price
What is Technical Analysis?
Technical analysis approaches the market from a different direction.
Instead of primarily asking what a company is worth, technical analysis studies price and market behaviour.
Technical analysts may examine:
Price trends
Support and resistance
Volume
Moving averages
Momentum
Volatility
Chart patterns
Breakouts and breakdowns
Relative strength
Market structure
The question becomes:
“What is the market telling us about price and momentum right now?”
For example, a stock may be fundamentally attractive, but if its price is in a strong downtrend, a technical analyst may wait for evidence that the trend is changing before entering.
Technical analysis is therefore often used for timing, risk management and identifying potential entry and exit points.
Technical analysis is largely about:
Price → Trend → Momentum → Market Behaviour → Timing
The Simplest Way to Understand the Difference
Think of buying a house.
Fundamental analysis would involve asking:
Where is the house?
What is the quality of construction?
What is the neighbourhood like?
What is the rental potential?
What are comparable properties selling for?
What could the property be worth in five or ten years?
Technical analysis would ask:
What prices have properties recently traded at?
Is the market trending higher or lower?
Are buyers becoming more aggressive?
Is there resistance around a particular price?
Is momentum improving?
The first approach is trying to understand value.
The second is trying to understand behaviour and timing.
Both can provide useful information, but they are answering different questions.
Fundamental Analysis: More Relevant for Investors
For someone investing for five, ten or twenty years, fundamentals can form the foundation of the investment decision.
An investor may identify a company with strong long-term prospects and then ask:
Is the current valuation reasonable?
This is important because a great company is not automatically a great investment at any price.
Suppose two companies are equally strong businesses.
Company A trades at a valuation that already assumes very high future growth.
Company B trades at a more reasonable valuation.
Fundamental analysis helps investors think beyond:
“Is this a good company?”
and towards:
“At this price, does the potential return justify the risks?”
That distinction is extremely important.
Technical Analysis: More Relevant for Timing and Risk Management
Technical analysis can be particularly useful for investors and traders who need to make decisions around when to enter, when to add, when to reduce and when to exit.
Consider an investor who has identified a fundamentally attractive company.
There may still be a question of timing.
Instead of investing the entire amount immediately, an investor might use price trends and market structure to determine whether:
The stock is gaining momentum
The stock is correcting
A long-term support level is holding
A breakout is occurring
The trend has weakened
Technical analysis can therefore become an additional decision-making and risk-management tool.
It doesn't necessarily tell you what a company is worth.
It can help you understand how the market is currently behaving around that company.
What About Short-Term Traders?
This is where the distinction becomes even more important.
For an intraday trader, a company's five-year earnings outlook may have very little relevance to whether a trade should be taken at 10:15 AM.
The trader may instead focus on:
Price action
Volume
Market structure
Momentum
Liquidity
Volatility
Support/resistance
Risk-to-reward
Broader market conditions
For a long-term investor, however, a five-year earnings trajectory may matter significantly more than what the stock did during today's trading session.
The time horizon changes the importance of the tools.
Can Fundamental and Technical Analysis Be Used Together?
Absolutely.
In fact, investors don't necessarily need to choose one or the other.
Consider a simple framework:
Step 1 - Fundamental Analysis
Identify businesses that have:
Strong business fundamentals + attractive long-term opportunity + sensible valuation
Step 2 - Technical Analysis
Then examine:
Trend + momentum + market structure + potential entry levels
Step 3 - Risk Management
Finally ask:
How much should I invest? What could go wrong? At what point would my original thesis need to be reconsidered?
This creates a more comprehensive decision-making process.
A Simple Example
Imagine an investor is considering Company X.
Fundamental picture
Revenue growth: Strong
Profit growth: Strong
Debt: Moderate
Cash flow: Healthy
Industry outlook: Positive
Valuation: Reasonable
The fundamental picture looks constructive.
But now consider the chart.
The stock has recently fallen 20%, remains below its major moving averages and has not yet demonstrated a meaningful reversal.
The fundamental investor may conclude:
“The business remains attractive, so I am willing to hold it for the long term.”
A more timing-focused investor may conclude:
“The business looks attractive, but I would like to see some evidence of price stabilisation before committing more capital.”
Neither approach necessarily contradicts the other.
They simply have different objectives.
One Important Warning: Neither Approach Predicts the Future
This is perhaps the most important point for investors.
Fundamental analysis is not a crystal ball.
A company can have excellent fundamentals and still experience a significant fall in its stock price.
Why?
Because markets can react to:
Valuation changes
Economic cycles
Interest rates
Competition
Regulation
Investor sentiment
Unexpected events
Similarly, technical analysis is not a crystal ball either.
A breakout can fail.
A support level can break.
A trend can reverse unexpectedly.
A technical setup represents probability, not certainty.
This is why risk management remains important regardless of the approach.
Common Mistakes Investors Make
Mistake 1: Buying a “good company” at any price
A great business can still be an expensive investment.
Business quality and investment valuation are not the same thing.
Mistake 2: Assuming a falling stock is automatically cheap
A stock falling 40% does not necessarily mean it is undervalued.
The underlying earnings and business outlook may also have deteriorated.
Mistake 3: Treating chart patterns as guarantees
No chart pattern guarantees a future outcome.
Technical analysis should be used within a defined risk framework.
Mistake 4: Mixing time horizons
An investor may buy a stock based on a long-term fundamental thesis but panic because the stock falls 8% in a week.
Before investing, it is important to know:
Am I making an investment decision or a trading decision?
Mistake 5: Ignoring valuation
A strong company, a strong trend and a strong story can all coexist with an excessive valuation.
Price still matters.
So Which One Should an Investor Use?
There is no universal answer.
It depends on who you are, why you are investing and what your time horizon is.

The important lesson is not to ask:
“Which is better?”
Instead ask:
“Which tool is appropriate for the decision I am trying to make?”
The ARKa Invest Perspective
At ARKa Invest, we believe investing should begin with clarity of objective.
Before looking at a chart or a financial statement, investors should understand:
What am I investing for?
A retirement goal requires a different approach from a three-month trading opportunity.
A child's education corpus requires a different framework from an opportunistic equity trade.
Fundamental analysis can help investors understand what they own and why they own it.
Technical analysis can help investors understand market behaviour, timing and risk around an investment.
And portfolio construction brings everything together by answering another important question:
How does this investment fit into my overall financial plan?
Because ultimately, successful investing isn't about finding one perfect indicator, ratio or chart pattern.
It is about having a process.
Understand the objective.
Understand the asset.
Understand the risks.
Understand the valuation.
Understand the market environment.
And most importantly, make sure the investment fits the portfolio and the investor's time horizon.
Fundamentals can help explain the “what” and “why”.
Technicals can help explain the “when” and “how”.
Good investing requires knowing when each lens is useful.
This article is intended for educational and awareness purposes only and should not be construed as investment advice or a recommendation to buy or sell any security.
Related Articles